


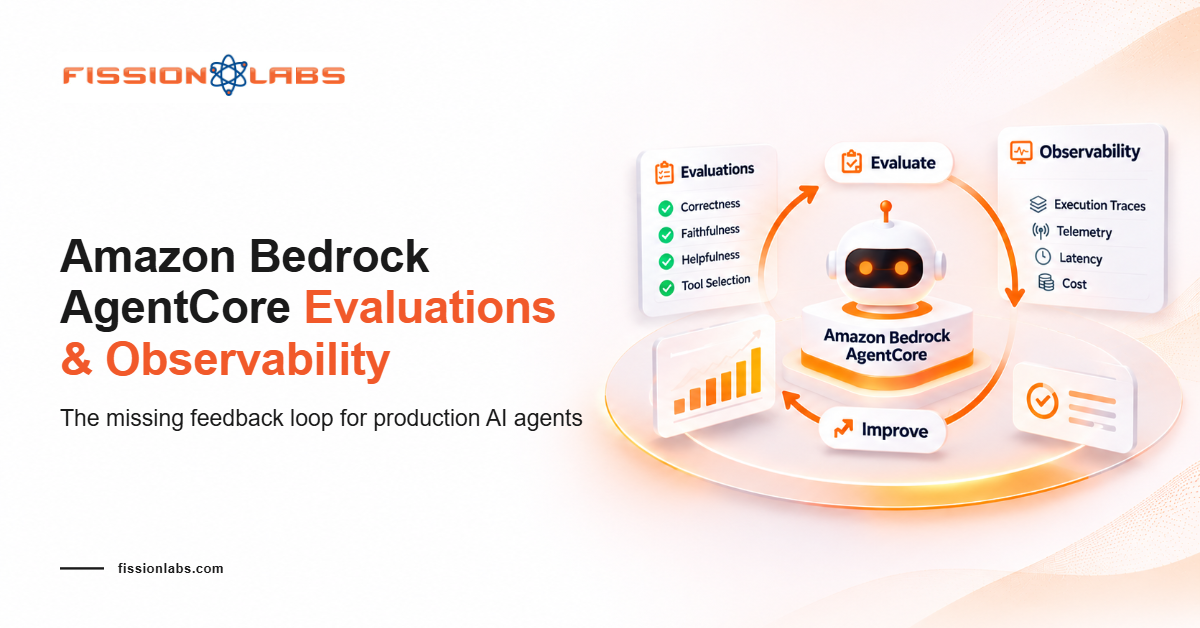
An agent doesn't degrade all at once. It gets a little worse , one conversation at a time , until someone notices before you do. That's the uncomfortable part of shipping something that reasons instead of following a fixed script: passing every test in staging tells you almost nothing about whether it's still working three weeks into production, with real users saying things you never scripted for.
Amazon Bedrock AgentCore's Evaluations launch, read alongside AWS's AgentOps guidance on evaluation and observability, treats this as a structural problem rather than a monitoring afterthought. A demo that worked once and an agent that keeps working are two different claims, and you need two different systems to verify each one , evaluation to define what "good" looks like, and observability to see, continuously, whether reality still matches it.
Why "It Passed the Test" Isn't the Same Question as "Is It Still Working"
Traditional software fails loudly , an exception, a stack trace, a failed assertion. Agents fail differently. A wrong tool selection, a subtly incomplete answer, a memory retrieval that pulled the wrong context , none of these throw an error. They just produce a slightly worse outcome, and slightly worse outcomes compound across a long session in ways that are genuinely hard to notice from the outside.
That's the gap Evaluation and Observability close, from two different directions. Evaluation asks "was this correct, against a standard we defined ahead of time." Observability asks "what actually happened, and can we see it clearly enough to know when correctness has drifted." A system with excellent evaluation and no observability validates a release and then flies blind for months. A system with excellent observability and no evaluation sees every trace in detail and still has no principled way to say whether any of it was good.
AgentCore Evaluations: Turning "Seems Fine" Into a Number You Can Alarm On
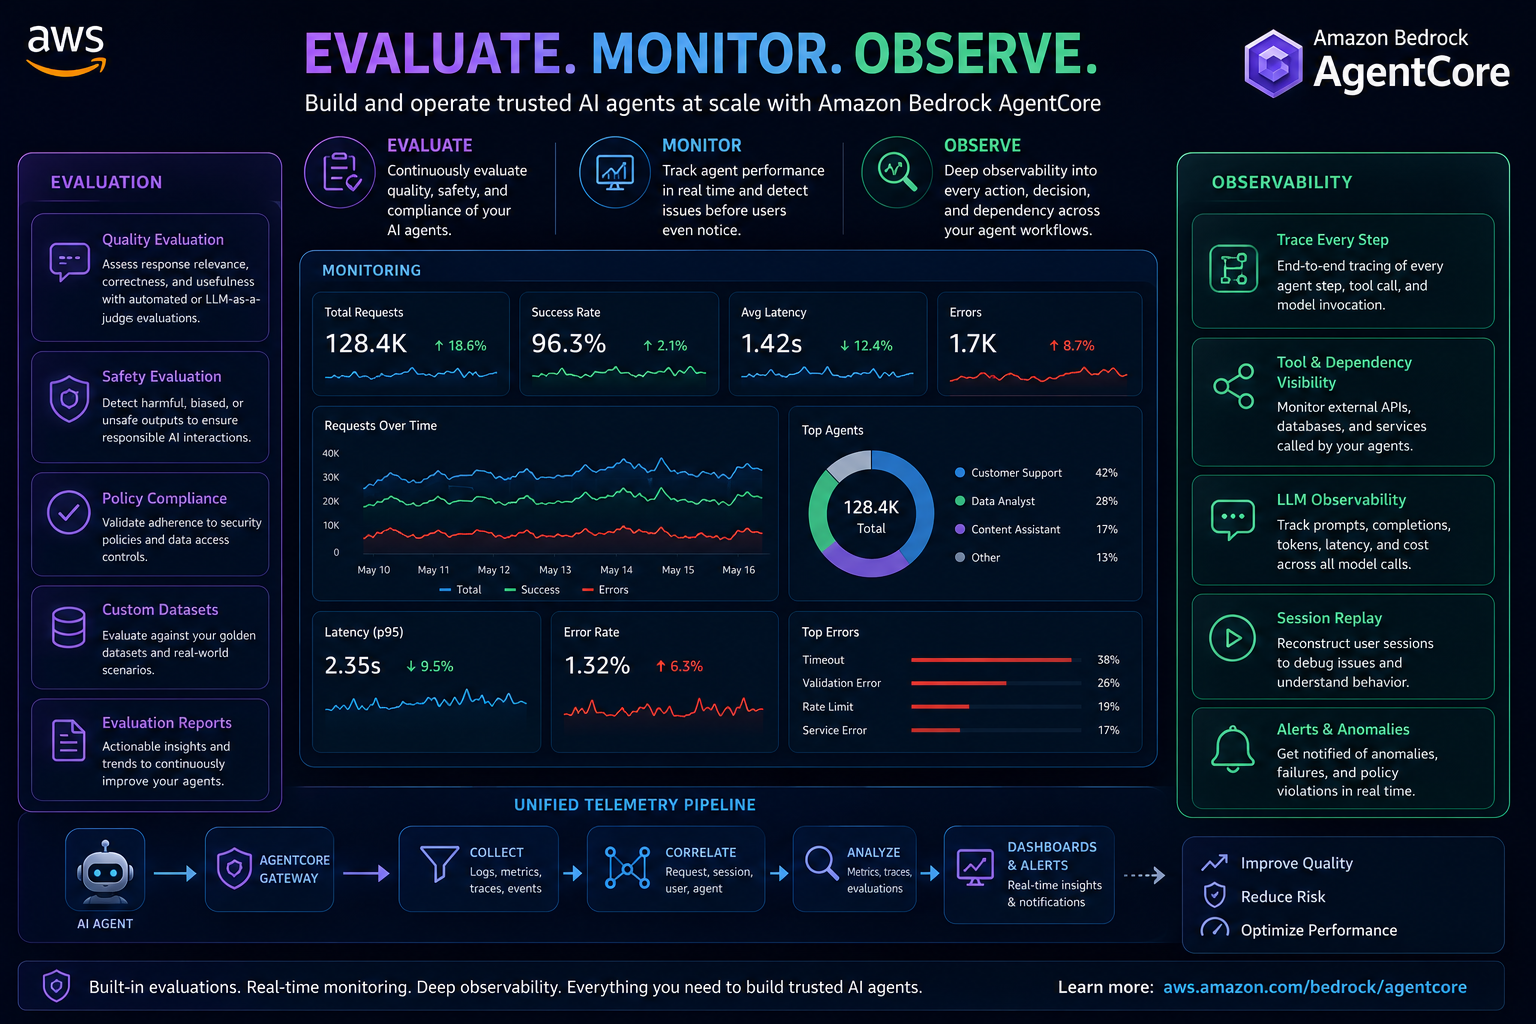
AgentCore Evaluations is a fully managed service that continuously monitors agent performance based on real-world behavior, not just curated test cases. It ships with built-in evaluators , correctness (is the response factually accurate), faithfulness (is it actually grounded in the context it was given, not just plausible-sounding), helpfulness (how useful was it from the user's side), and harmfulness and stereotyping for content that's accurate but still shouldn't have been said. Dedicated evaluators for tool selection and parameter accuracy answer a question specific to agents: did it pick the right tool, and extract the right parameters from what the user actually said.
Custom evaluators let you shape scoring around your own domain. You provide the judge model, its inference parameters, a prompt with the judging instructions, and an output scale , numeric or custom labels , then choose whether it runs per trace, per session, or per tool call.
Every result , built-in or custom , is published to Amazon CloudWatch alongside AgentCore Observability data, so scores and execution traces live in one place instead of two dashboards you correlate by hand. You can select any bar in the results view and drill straight into the traces behind it, and because output lands in CloudWatch, it inherits alarms and automations you define once. AgentCore Evaluations works both ways: before deployment, to check a new version against a baseline and stop a faulty release; and continuously in production, sampling live traffic so a satisfaction or politeness score dropping over a defined window triggers an alert , the difference between "someone will probably notice eventually" and "we get paged before the complaint does."
Evaluation at Four Levels, Because a Correct Answer Isn't a Successful Session
An agent can be locally correct at every step and still fail the thing the user actually needed. Structured evaluation across four levels is what catches that.
Tool level (span-level). Deterministic tools (APIs) get unit tests and latency checks; LLM-backed tools (RAG) get scored on correctness, helpfulness, and harmfulness via human review or LLM-as-a-judge; retrieved data gets checked for retrieval quality and freshness; multimodal tools get modality-specific checks like fidelity and cross-modal consistency. Separately, the agent's use of the tool gets tracked through tool selection accuracy and parameter extraction accuracy.
Conversation turn level (trace-level). A single input-output pair, scored on correctness, faithfulness, relevance, coherence, and appropriate refusal. In multi-agent systems, this extends to orchestration accuracy , did the right agent get the handoff, and was the information exchange between agents actually useful.
Session outcome level. Did the agent achieve the user's goal across the whole conversation , task completion rate, goal accuracy, conversation efficiency, and memory consistency from first message to last.
System level. End-to-end latency, time-to-first-token, throughput, tool call error rates, loop detection, and cost per completed task, plus any custom business or regulatory metrics.
A support agent can nail tool selection and produce a coherent individual response, and still fail the session-level check because it took six turns to answer something that should've taken two. Only the level built to catch that, catches it.
Two Modes, Because Pre-Release Testing and Live Traffic Answer Different Questions
On-demand evaluation runs against specific spans, traces, or sessions during development, using reference inputs as a gold standard , turn-by-turn debugging, component validation, CI/CD integration. It tells you a new version is at least as good as the last one before anyone outside your team sees it.
Online evaluation continuously monitors live production traffic at a configurable sampling rate, feeding scores into CloudWatch dashboards in real time.
The practical pattern: on-demand runs in dev for fast iteration, then becomes a hard pipeline gate in pre-production , the build doesn't promote until it passes. In production, online evaluation takes over, and a quality drop feeds a human review queue or triggers an automated rollback. The principle is blunt and correct: detect quality issues before your users do, not after.
Observability: Where the Loop Actually Closes
Evaluation tells you whether an agent works at release time. Observability tells you whether it keeps working, and why it stopped. It's where the AgentOps cycle genuinely closes , the telemetry it produces feeds back into the next evaluation cycle and shapes what gets built differently next time.
Production agents need visibility across four telemetry layers, each catching failures invisible to the others: agent and framework telemetry (reasoning steps, model calls, tool invocations from the agent framework itself); service telemetry (memory reads/writes, gateway routing, identity and policy evaluations , operations that happen outside the framework and are invisible to it no matter how well-instrumented the framework is); infrastructure telemetry (runtime container metrics, Lambda execution data); and application telemetry (business metrics spanning multiple agents).
Within these layers, the specific things worth capturing: execution tracing, structured logging correlated across agents, latency and token metrics with alerting, memory visibility (catching a misconfiguration before it discloses user context), responsible-AI signals (toxicity, bias, PII leakage), cost per session/agent/task, and , easy to deprioritize, genuinely important , human-centric metrics like satisfaction and trust. Every other metric tells you how the agent performed technically. This one tells you whether it mattered to the person on the other end.
One Line to Turn the Lights On
Three layers: Instrumentation via the OpenTelemetry SDK (embedded directly, or framework-native , the Strands SDK ships with it built in), a collection layer (typically the AWS Distro for OpenTelemetry Collector), and an analysis backend (commonly CloudWatch). For Python agents without built-in instrumentation, bootstrapping is a one-line addition:
opentelemetry-instrument python my_agent.py
Telemetry exports via OTLP to an ADOT collector, which handles sampling, filtering, and routing; production setups should keep the Collector as an intermediate layer rather than a direct pipe. When an architecture spans multiple agents on different frameworks, OpenTelemetry's W3C Trace Context propagation carries a shared trace ID across every service, giving you the complete execution path in one view instead of disconnected fragments; OpenTelemetry Baggage does the same for session IDs across separate traces.
Two Ways to Watch: Native CloudWatch or Third-Party via OTEL
AgentCore Observability in CloudWatch gives you two dashboards: a model invocation view covering Bedrock latency, tokens, and throttles, and a full Bedrock AgentCore Observability dashboard covering traces, cost, latency, and custom metadata, with IAM controls and PII redaction built in. It's powered by CloudWatch Transaction Search, which converts spans into structured, searchable logs, and Application Signals correlates the agent telemetry with underlying infrastructure metrics so a latency spike shows up as one connected story. AgentCore Runtime configures the log groups and OTEL environment variables automatically , apps just add the OpenTelemetry SDK as a dependency.
Third-party observability via OpenTelemetry works because AgentCore Runtime exports standard OTEL, plugging into agent-centric tools like LangFuse. A self-managed deployment runs the tool in your own AWS account or VPC, with data governance staying entirely under your control. A third-party SaaS approach sends data to a managed cloud endpoint , faster to stand up, but telemetry (which can include reasoning traces and tool inputs) leaves your AWS environment, which is worth a deliberate governance conversation rather than a default made for onboarding speed.
Why Bidirectional Streaming Makes Latency a First-Class Metric
AgentCore Runtime's bidirectional streaming lets voice agents listen and adapt while a user is still speaking , interruptible mid-response, without waiting to finish the current output. That's a different interaction model than turn-based text, where a few hundred extra milliseconds barely registers. In a flowing voice conversation, that same latency is the difference between natural and broken.
This is exactly why time-to-first-token stops being a metric you check occasionally and becomes one you monitor continuously, with alarms. A voice agent that's accurate but slow to start responding isn't a minor quality issue , it's a broken interaction model. The four telemetry layers are what actually catch this: agent telemetry shows reasoning time, service telemetry shows gateway and tool latency inside the response, infrastructure telemetry shows whether compute is the bottleneck. Streaming agents don't need a different observability system. They need the existing one tuned to treat latency as seriously as correctness.
What This Looks Like Stacked Together
Take a support agent three weeks after launch. On-demand evaluation validated it before release , tool selection, correctness, and session-level task completion all cleared their thresholds, and CI/CD gated promotion on exactly that. In production, online evaluation samples live sessions continuously, scoring helpfulness and faithfulness in real time, while four telemetry layers run underneath: agent telemetry shows the reasoning path, service telemetry shows memory and gateway calls, infrastructure shows container health.
Three weeks in, helpfulness scores drift down over an eight-hour window , subtle enough to miss by eyeballing individual conversations. Because the threshold was defined ahead of time, CloudWatch fires an alert instead of waiting for a support ticket. The team drills into the traces behind that score and finds a tool that starts timing out more often, causing the agent to fall back to a less complete answer. Evaluation alone couldn't have produced that finding , it can tell you the score dropped, but it takes observability's tracing to explain why. Neither system alone closes the loop. Together, they do.
Where This Still Needs Care
A few tradeoffs worth naming directly. LLM-as-a-judge evaluation is still a model judging a model , custom evaluator prompts need the same scrutiny any prompt does, and a badly specified judging prompt produces confidently wrong scores just as easily as a good one produces useful ones. Sampling rates for online evaluation are a real tradeoff, not a solved problem: too little and you miss a regression between samples; too much and evaluation becomes a meaningful cost and latency line item. And the third-party SaaS path is legitimate, but comes with an explicit data-residency tradeoff worth a deliberate conversation, not a default choice made for onboarding speed.
The Takeaway
Evaluation and observability aren't sequential steps , build, then evaluate, then observe. They're a continuous loop where each makes the other more useful. Evaluation defines what "working" means in numbers you can alarm on. Observability shows you, continuously, whether reality still agrees, and gives you the detail to understand it when it doesn't. An agent that passed every test you gave it isn't the same claim as an agent that's still working today , closing that gap is the point of building this loop at all.
References
- https://aws.amazon.com/blogs/aws/amazon-bedrock-agentcore-adds-quality-evaluations-and-policy-controls-for-deploying-trusted-ai-agents/
- https://aws.amazon.com/blogs/machine-learning/agentops-operationalize-agentic-ai-at-scale-with-amazon-bedrock-agentcore/
- https://docs.aws.amazon.com/bedrock-agentcore/latest/devguide/what-is-bedrock-agentcore.html